
Rising supply share creates a tiered opportunity structure
In January–September 2026, Brazil imported US$58.623 billion in goods from China, up 9.88% year on year, an increase of US$5.27 billion. Over the same period, Brazil’s global imports grew 5.04%, and China’s source share rose from 25.21% to 26.38%. Chinese supply chains continued to gain weight in Brazil’s procurement system. [1] [2]
The distribution of incremental growth differs markedly. Vehicles and parts, electrical and electronic products, and machinery together accounted for 54.85% of imports from China. The vehicle chain expanded strongly, electronics growth was concentrated, and expansion within the plastics chapter was broader; different structures correspond to different customer, funding and delivery requirements.
On the consumer side, in Q2 2026 household consumption fell 0.4% quarter on quarter on a seasonally adjusted basis and grew 0.5% year on year. On the corporate side, fixed capital formation grew 1.2% quarter on quarter, but the first-half cumulative total was unchanged from the previous year. Demand is resilient, while the pace of growth has become more moderate. Retail stocking and industrial projects should use their own demand and payment indicators. [3]
Brazil’s digital channels already provide large-scale reach. Platform search, brand content, messaging and Pix payments connect the customer purchase process; local inventory, delivery and after-sales support connect transaction completion. The scale advantages of Chinese supply need to be converted into specifications, costs and services that customers can compare.
This report extends from trade structure to the economy, industries, channels and fulfillment, providing companies with a framework for market judgment. The industries and product codes in the report are used to explain structure; a company’s business direction is determined by customer demand and its own channel conditions.
Economy and purchasing power: consumption resilience coexists with funding constraints
Different rhythms in aggregate growth and household consumption
IBGE reported that Brazil’s real GDP grew 2.3% in 2025. In Q2 2026, GDP grew 0.5% quarter on quarter on a seasonally adjusted basis, household consumption fell 0.4%, and fixed capital formation grew 1.2%. Year on year, GDP grew 2.0%, household consumption grew 0.5%, and fixed capital formation grew 1.4%. The investment rate for the quarter was 16.1%, lower than 16.6% in Q2 2025. [4] [3]
Quarter-on-quarter and year-on-year comparisons together describe the state of demand: household consumption remained above the same period of the previous year, but declined compared with the first quarter; investment improved in the quarter, while the cumulative total for the first half of 2026 was unchanged from the previous year. When preparing order plans, companies should consider both customers’ sustained purchasing capacity and the recent transaction pace.
The moving-quarter unemployment rate for June–August 2026 was 5.3%, and usual real labor income was R$3,777 per month. The month-on-month IPCA for month 9 was 0.82%, and the cumulative rate over the 12 months through month 9 was 4.58%. Employment and real income provide the basis for consumption, while price changes in essential spending affect the remaining budget. [5] [6]
In this environment, customers compare the total payment amount, payment timing and service scope in addition to product price. Budget-sensitive customers focus on the initial payment and essential spending, while experience-oriented customers also compare quality and after-sales support. National average income describes the economic context; specific customer groups should be segmented by sales area, price band and payment record.
Procurement and inventory in a high-interest-rate environment
In its 16 September 2026 decision, Brazil’s central bank set the Selic target rate at 13.75% per year. The Selic is a policy benchmark; companies’ actual financing costs also include bank spreads, tenors, guarantees and credit conditions. [7] [8]
The funding chain of import operations begins with advance payment, then passes through goods in transit, customs clearance, warehousing and sale, and finally reaches cash collection. The larger the procurement volume and the longer the turnover period, the greater the funding need. In a growth market, the operating focus is to connect ordering, arrival and cash collection, rather than simply increasing inventory.
Retail businesses can arrange replenishment based on sold inventory, completed payments and post-refund revenue; distribution businesses focus on customer credit and receivables terms; project businesses align equipment, installation, acceptance and payment milestones. Using different funding structures for different businesses can improve the sustainability of growth.
Global procurement competition: China’s rising share and changes in source countries
In 2025, Brazil’s global imports were US$280.208 billion, of which US$70.916 billion came from China, giving China a share of 25.31%. In January–September 2026, global imports were US$222.259 billion, with US$58.623 billion from China, accounting for 26.38%. Compared with the same period in 2025, China’s share increased by about 1.16 percentage points. The global total and share use the same Comex Stat query scope. [1] [2]
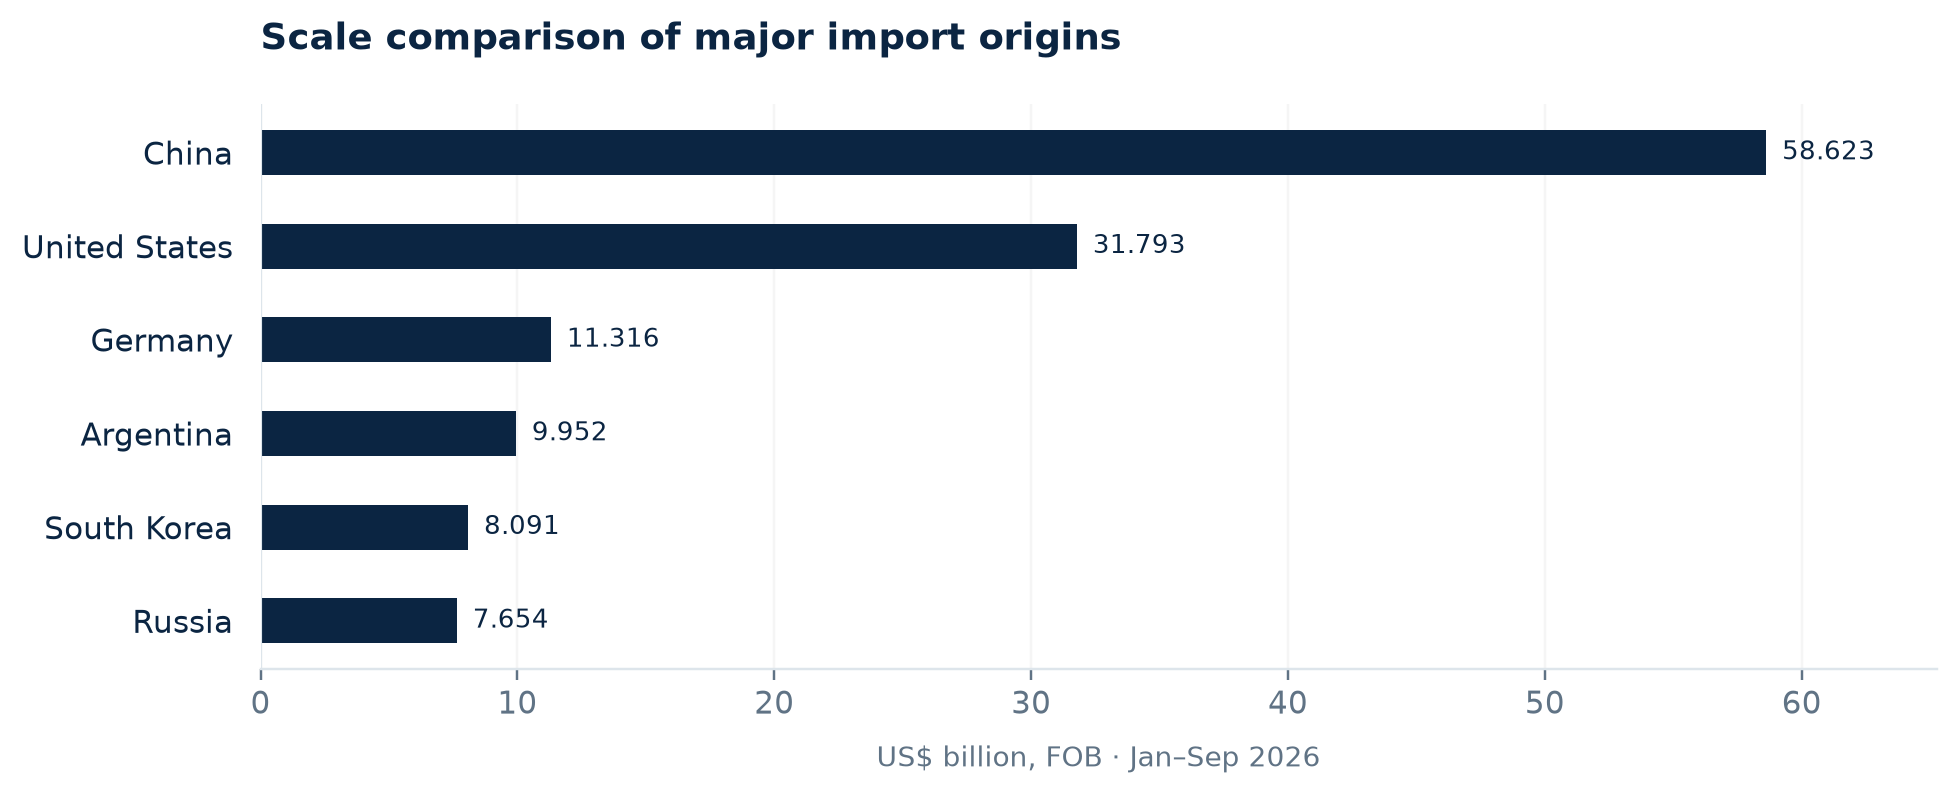
Over the same period, imports from the United States were US$31.793 billion, down 7.10% year on year; Germany was US$11.316 billion, up 4.01%; Argentina was US$9.952 billion, up 4.43%; South Korea was US$8.091 billion, up 103.38%; and Russia was US$7.654 billion, down 0.39%. China and South Korea rose faster, and the source-country structure is adjusting. [9]
China’s contribution to the increase in Brazil’s imports
In the first nine months of 2026, Brazil’s global imports increased by about US$10.664 billion, of which imports from China increased by US$5.27 billion, contributing 49.42% of the global net increase. Imports from other sources combined grew 3.41%, below the 9.88% growth in imports from China. This decomposition is consistent with the overall increase in China’s share. [1] [2]
Further decomposing products from China, vehicles and parts HS87 added US$4.858 billion, accounting for 45.56% of the net increase in Brazil’s global imports. After excluding the entire HS87 chapter from imports from China in both periods, the remaining imports combined grew 0.84%. The vehicle chain is the main driver of overall growth in imports from China; other industries should use their own incremental growth, physical volume and customer procurement conditions to judge operating pace.
The 49.42% and 45.56% here use the global net increase as the denominator, describing the contribution of sources and products to the net change. The 0.84% applies to the non-HS87 portfolio from China, and answers a different question from the analysis below that excludes a single 8703 heading.
In September 2026, imports from China were US$7.063 billion, up 12.59% year on year; in that year, month 2 was US$5.494 billion and month 6 was US$7.79 billion. Monthly arrivals fluctuate, and channel replenishment should be managed together with inventory, customer procurement and shipping schedules. [10] [9]
Procurement use: intermediate goods dominate, while consumer imports grow faster
In Brazil’s global imports in January–September 2026, intermediate goods were US$125.375 billion, accounting for 56.4% and down 0.8% year on year; capital goods were US$34.095 billion, accounting for 15.3% and up 2.1%; consumer goods were US$38.755 billion, up 23.1%; and fuels and lubricants were US$23.916 billion, up 18.3%. Other unspecified goods were US$117 million, accounting for about 0.05% of global imports; the five categories together match total global imports. [2]
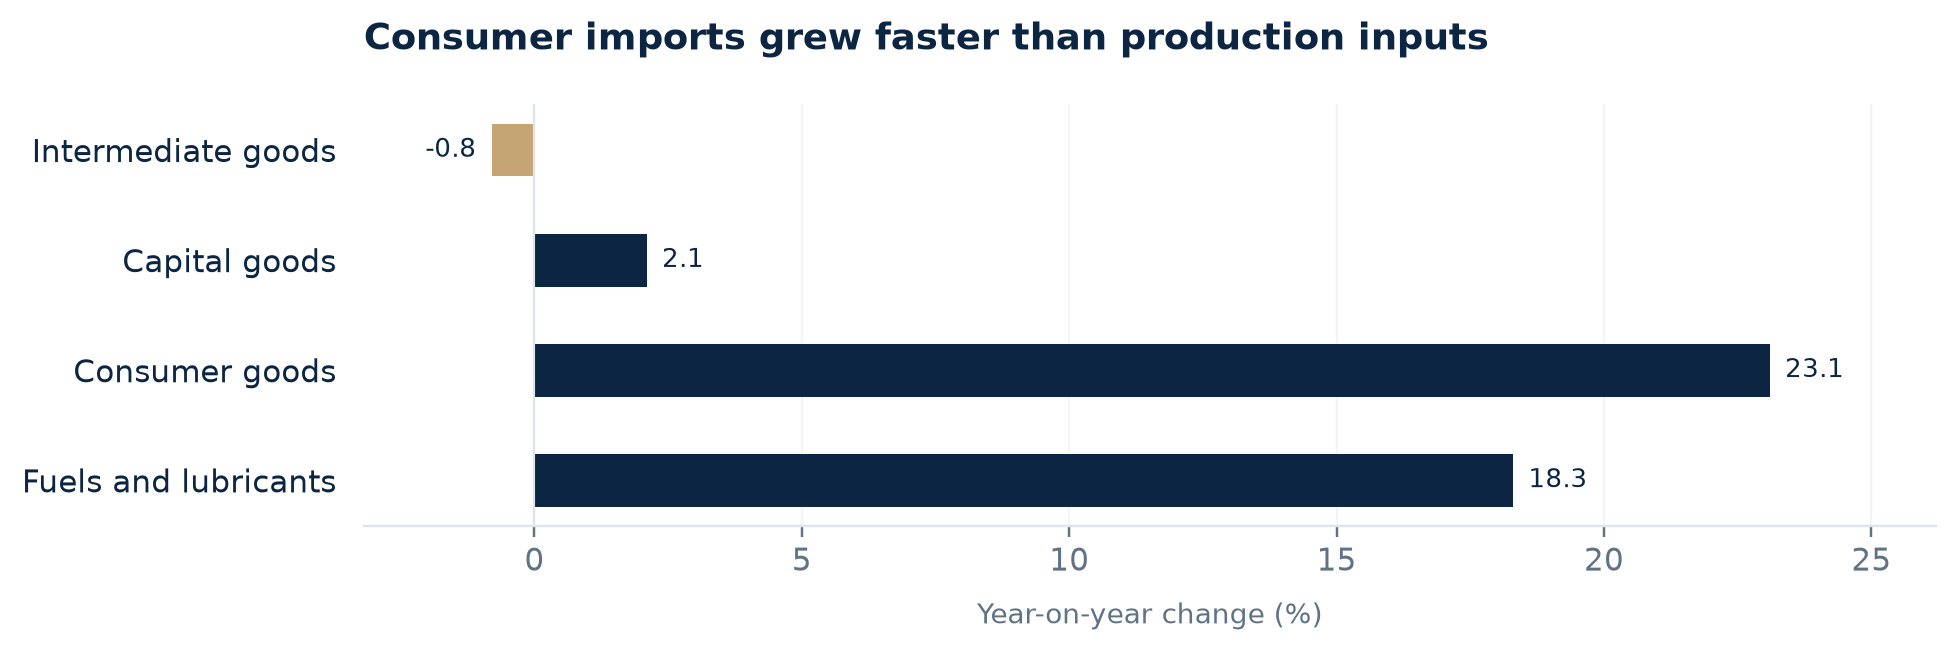
Intermediate goods remain the main body of the procurement system, while consumer imports contribute faster growth. Decision chains differ greatly by use. Buyers of intermediate goods focus on manufacturing continuity, processes, batches and quality traceability; buyers of capital goods focus on installation, training, warranty and production-start timing; buyers of consumer goods focus on customer groups, price bands, replenishment and after-sales support.
For production customers, customer-acquisition content should show parameters, operating conditions and batch evidence, and clarify existing equipment and production conditions in the first communication. For equipment customers, quotations should distinguish responsibilities for goods, installation and services. For channel customers, product presentation and commercial communication need to state the user experience, packaging, delivery and after-sales support directly.
In the September 2026 cross-section of imports from China, intermediate goods accounted for 63.6%, capital goods for 16.2%, and consumer goods for 20.2%. Chinese supply remains closely linked to the local production system, and industrial demand and channel-based demand should be managed separately. [10]
Structure of supply from China: three major industries coexist with specialized segments
Electrical and electronic products HS85 imports were US$12.163 billion, machinery HS84 was US$10.55 billion, and vehicles and parts HS87 were US$9.44 billion, together accounting for 54.85% of imports from China. Organic chemicals HS29 were US$4.456 billion, plastics HS39 were US$2.319 billion, and miscellaneous chemicals HS38 were US$2.178 billion. [1]
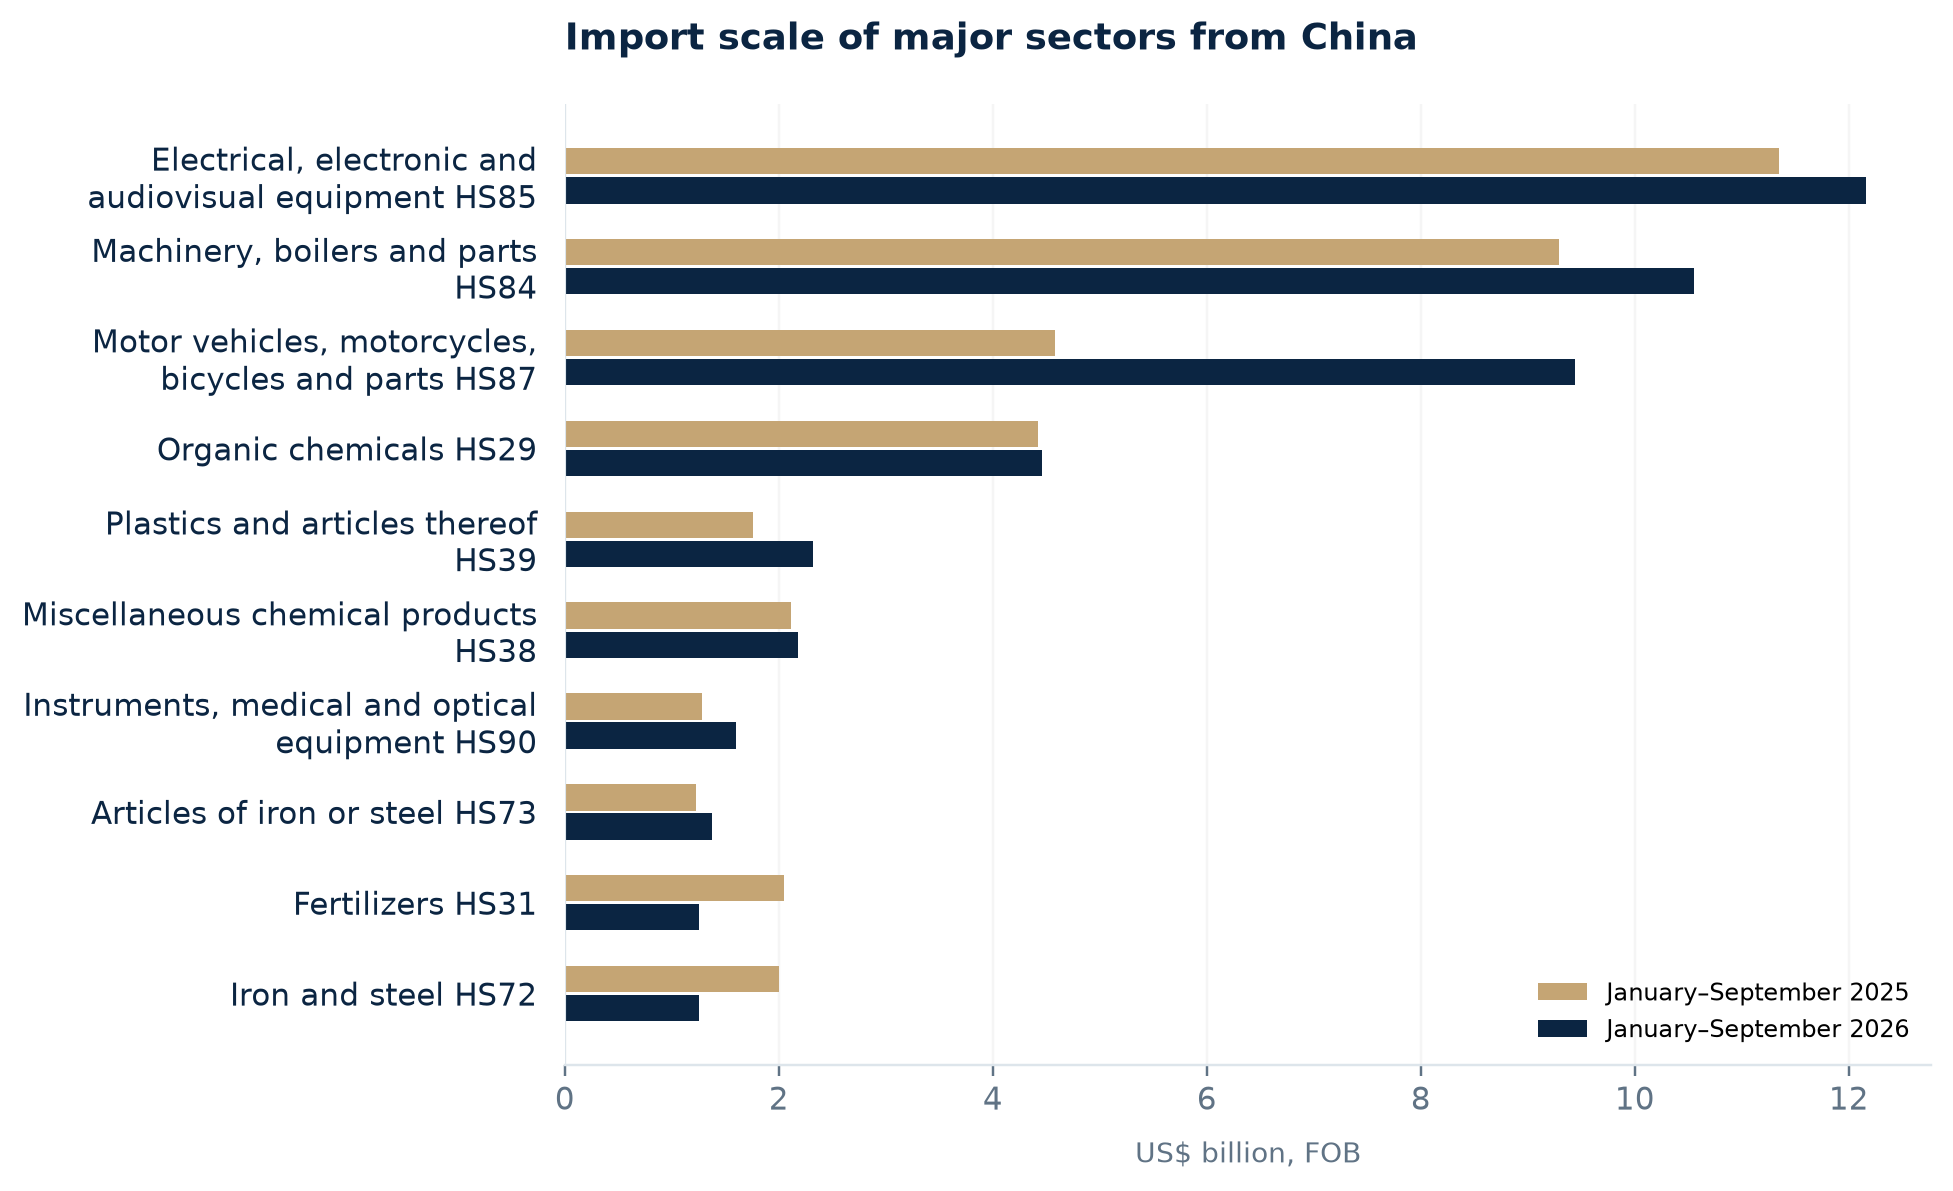
The top 10 HS4 headings accounted for 31.21% of imports from China, and the top 100 accounted for 74.35%; the remaining 969 headings totaled about US$15.034 billion. Leading-scale businesses and specialized segments coexist. Leading businesses depend on corresponding funding, channel and service systems, while specialized segments depend on clear uses and sustainable procurement relationships. [1]
Value concentration describes the product structure. Customer and brand competition should be further segmented by procurement channel, use case and local service. Machinery distribution, factory procurement and project integration have different quotation content, acceptance arrangements and cash-collection cycles even when they involve the same chapter.
Sources of growth: large-value headings and broad expansion work together
Growth and contraction behind the net increase
Passenger cars 8703 increased by US$3.902 billion, motor vehicle parts 8708 increased by US$656 million, integrated circuits 8542 increased by US$470 million, and electric accumulators 8507 increased by US$292 million. The four items together increased by US$5.32 billion. Over the same period, light-vessels, fire-floats, dredgers and other special vessels 8905 decreased by US$2.661 billion, and other fertilizers 3105 decreased by US$746 million. [1]
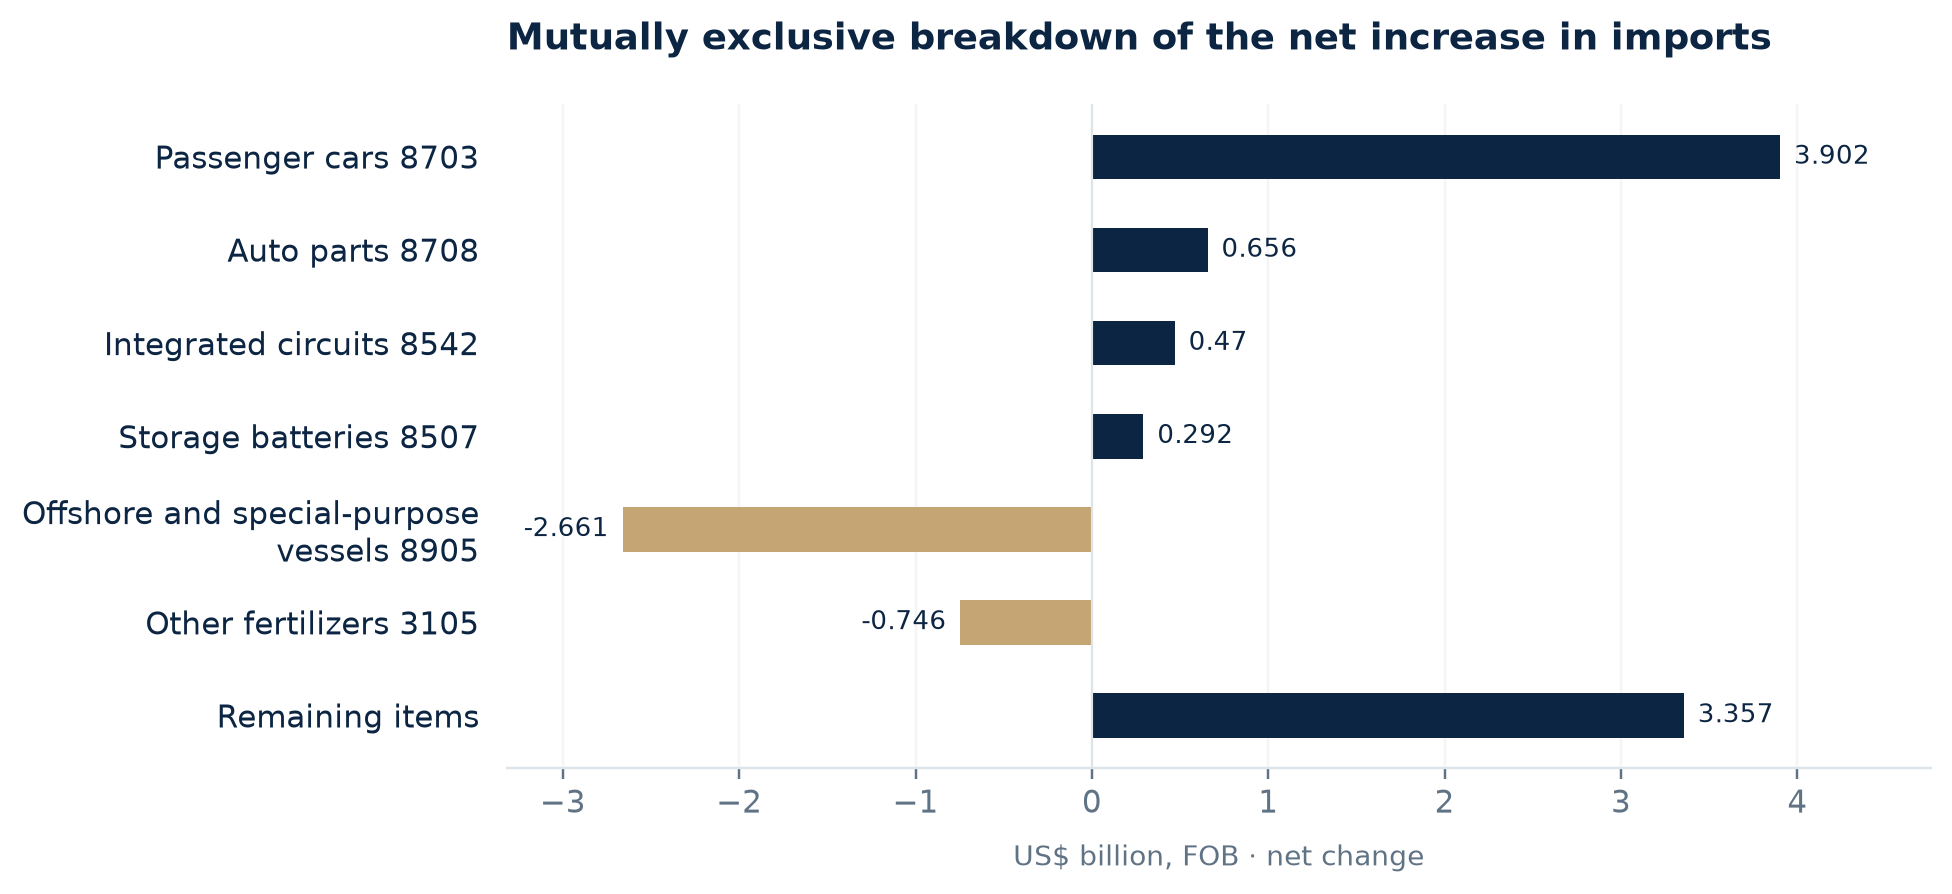
The increase from all growing headings was US$11.482 billion, and the decrease from declining headings was US$6.213 billion; offsetting them based on unrounded amounts produced the US$5.27 billion net increase. Growth and contraction both occurred within goods flows of considerable scale, so the aggregate net amount needs to be read together with changes on both sides.
HS87 vehicles and parts recorded a net increase of US$4.858 billion, accounting for 92.20% of the net increase from China; passenger cars 8703 contributed US$3.902 billion, accounting for 74.05% of the net increase from China. This contribution uses net growth as the denominator, and can approach or exceed 100% when other areas contract.
8905 fell from US$2.661 billion in the same period of 2025 to about US$102800 in the same period of 2026. This tariff heading covers dredgers, floating docks and drilling or production platforms, among others, and should be observed by the annual distribution of large-value deliveries and specific goods. Routine channel replenishment and special equipment delivery are better analyzed separately.
Breadth of growth beyond large-value headings
After excluding 8703 in both periods, the remaining headings grew 2.68% year on year; after also excluding 8905, they grew 15.64%; after excluding both items together, they grew 8.34%. These analyses synchronously remove the corresponding amounts in both periods and recalculate growth rates, separately observing the effects of the automobile and offshore-engineering bases. [1]
Among the 1069 studied headings, 682 grew, 384 declined, and 3 were unchanged, with growing headings accounting for 63.80%. 997 headings had positive value records in the same periods of both years. The 36 headings with newly positive records totaled about US$1.0539 million, accounting for about 0.0018% of the total in the same period of 2026; market-wide expansion was concentrated in existing tariff-heading product lines.
Within industries: electronics growth is concentrated, while plastics expansion is broader
Electrical and electronics: many headings grow, while value growth is concentrated
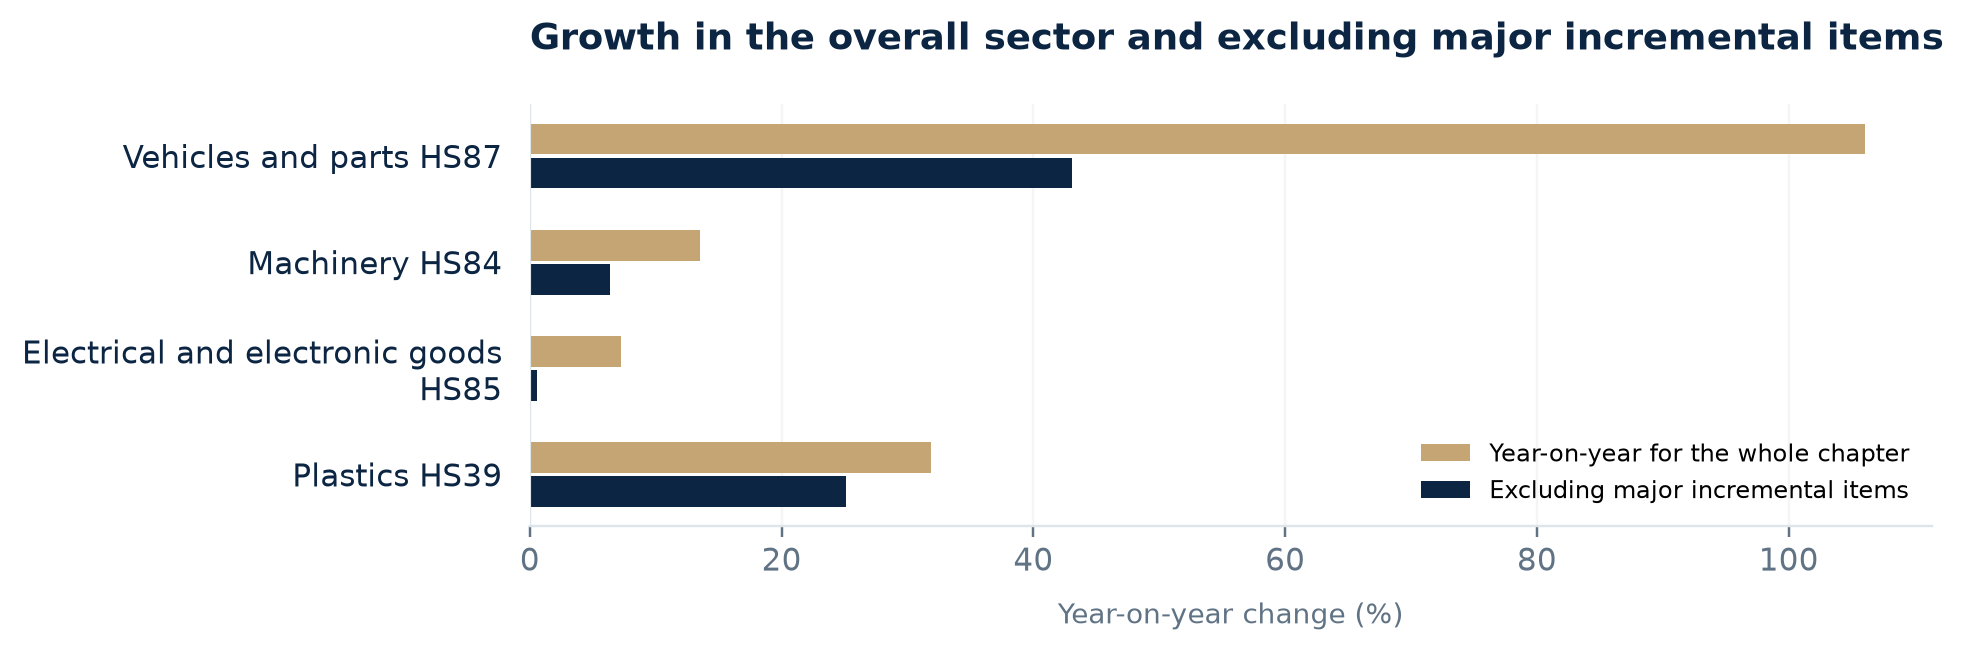
HS85 grew 7.21% overall. Integrated circuits 8542 and electric accumulators 8507 together contributed 93.16% of the chapter’s net increase; after excluding both in both periods, the remaining headings grew 0.58%. Among 48 headings, 37 grew, showing an increase across many headings while fewer headings contributed most of the value increase. [1]
When companies focus on electronics, they should identify which system the product enters, who procures it, how technical specifications are determined, and who is responsible for after-sales service and upgrades. Application scenarios and supporting supply arrangements should appear in customer communication before broad industry labels.
Plastics: growth is more broadly distributed
HS39 grew overall by 31.85%, with growth in 22 of 26 items. After excluding the largest incremental item, 3901, the remaining items still grew by 25.14%. This differs from the concentrated incremental structure in the electronics chapter and reflects value expansion across more product links. [1]
Primary materials, processed materials and finished products follow different procurement logics. Materials customers compare composition, processing suitability and guaranteed values, while finished-goods customers compare specifications, functions, packaging and channel uses. Companies need to break chapter-level growth down to procurement links, then set standards for supplier and customer communication.
Fertilizers: declines also have a concentrated structure
HS31 declined overall by 39.10%, and 3105 contributed 92.98% of the net decrease. After excluding this item in both periods, the remaining fertilizer items together declined by 5.05%. There is a clear difference between the decline of the overall chapter and the decline of a specific tariff line. [1]
When operators compare materials businesses, they should organize quotations by guaranteed values, uses, quantity units and customers’ production cycles. National import value describes trade value, while volume, product mix and inventory data help explain specific procurement changes.
Automotive ecosystem: imports, assembly and after-sales create multi-layer demand
China-sourced HS87 rose from 4.582 billion to US$9.44 billion, up 106.05%. Passenger cars 8703 reached US$6.262 billion, up 165.33%; auto parts 8708 reached US$1.761 billion, up 59.34%. 8703 contributed 80.31% of the net increase in the vehicles chapter; after excluding 8703 in both periods, the remaining vehicles and parts still grew by 43.06%. [1]
ANFAVEA reported automobile production of 2.166 million vehicles in January–September 2026, up 8.7% year-on-year; registrations of 2.257 million vehicles, up 18.1%; and imported finished vehicles of 463900 vehicles, up 30.4%. Of the production increase, 123000 vehicles came from CKD/SKD assembly. Starting in 2026, the association included estimated non-member production; this methodological change should be retained when reading year-on-year comparisons. [11] [12]
ABVE reported sales of 381609 vehicles light electrified vehicles in January–September 2026. Its definition includes battery electric vehicles (BEV), plug-in hybrid electric vehicles (PHEV), conventional hybrid electric vehicles (HEV) and HEV Flex, and excludes MHEV. This item is counted separately from total automobile production, total registrations and customs imports. [13]
Localization expands the links for commercial collaboration
Finished-vehicle introduction, local assembly and after-sales networks form an interconnected operating system. Finished-vehicle distribution focuses on models, prices and delivery; assembly procurement focuses on systems, parts and technical certification; repair networks focus on compatibility, spare parts and service response. Rising trade scale creates broader commercial contact, and the cooperation model should match the specific customer role.
MOVER creates requirements and incentives around energy efficiency, safety, recyclability, labeling, and investment in Brazilian R&D and production. In the second half of 2026, the designated CKD/SKD import-duty quota at 0% totaled US$463 million FOB, implemented according to the applicable NCM/Ex, company eligibility and licensing arrangements. This policy path is managed separately from finished-vehicle imports. [14] [15] [16]
Industrial procurement: maintenance renewal and project construction require separate operations
IBGE’s industrial production survey shows that in 2025, total industrial output grew by 0.6%, while capital-goods output fell by 1.5%; in January–August 2026, total industrial output grew by 0.8%, capital goods fell by 5.3%, and durable consumer goods grew by 2.1%. Overall industry, equipment production and durables performance diverged. [17] [18]
In the CNI survey, 72% of responding industrial companies said they implemented investment in 2025; the share planning investment in 2026 was 56%. Approved industrial financing in BNDES2025 was R$71 billion, up 35%. Investment plans, financing approvals, contract signing and fund disbursement in enterprise surveys correspond to different procurement stages. [19] [20]
China-sourced machinery HS84 grew by 13.52%. Four items—lifting equipment 8426, other handling machinery 8428, earthmoving machinery 8429 and related parts 8431—contributed 57.99% of the net increase in the machinery chapter; after excluding them in both periods, the remaining machinery grew by 6.34%. Of 85 items, 57 grew. [1]
8426 grew by 279.24%, adding US$230 million; 8431 grew by 49.83%, adding US$187 million. Percentages and incremental value should be used together to assess the importance of growth, then combined with customer use cases to distinguish project delivery from routine renewal demand.
Maintenance-renewal procurement is organized around equipment in use, shutdown windows, interfaces and cycle planning. Customers need compatibility documentation, reliable spare parts and clear service response. This type of demand centers on the equipment lifecycle and maintenance plans.
Construction-project procurement is organized around technical specifications, funding, delivery schedules, installation and acceptance. Procurement timing after financing approval depends on contracts, disbursements and project execution; sales resources should be scheduled according to actual milestones.
Companies can provide technical compatibility and cost-in-use explanations during budget discussions, comparable parameters and delivery schedules after specifications are set, and training and maintenance records after delivery. Content and services for different stages can better support inquiry conversion and subsequent procurement.
Energy applications: capacity growth and local service jointly create value
EPE’s annual energy accounts show that in 2024, Brazil’s installed photovoltaic capacity was 48.468GW, with full-year generation of 70.665TWh, up 28.1% and 39.6% respectively from 2023. Distributed solar installed capacity was 35.892GW. ABSOLAR’s association snapshot for 20 July 2026 listed national photovoltaic installed capacity at 74.3GW. Annual accounts and association point-in-time statistics are presented separately. [21] [22]
Installed capacity describes capacity, while power generation describes output over a period. Customer decisions also require electricity load, connection status, compensation method and maintenance arrangements. Equipment, installation, monitoring and after-sales service together constitute system use value.
ANEEL stipulates that micro distributed generation is no higher than 75kW, while mini distributed generation is usually above 75kW and no higher than 3MW; electricity compensation credits are valid for 60 months. Rooftop, remote self-consumption and shared models correspond to different technical and commercial arrangements. [23]
The value of China-sourced storage batteries 8507 grew by 70.38%, while semiconductor devices 8541 fell by 30.80%. The battery tariff line includes uses such as starting, traction, portable and stationary applications, and the electronic-device tariff line also covers different applications. Specific projects define demand through models, system lists and installation documentation. [1]
Energy commercial relationships usually connect equipment procurement, system adaptation, construction and commissioning, and operations and maintenance. Customers need a clear delivery scope, warranty responsibilities and key-component arrangements; supplier comparison should cover both products and supporting services. For professional projects, market research should start from customer applications and operating conditions.
Materials and consumer chains: growth differences from raw materials to finished goods
Under the analytical grouping based on HS39, primary materials 3901–3914 rose from 798 million to US$1.167 billion, up 46.20%; processed materials and products 3916–3926 rose from 960 million to US$1.152 billion, up 19.94%. Waste plastics 3915 are listed separately. The grouping is used to explain the industry chain, while the original tariff lines remain statistically independent. [1]
Both materials and processed products grew, but their growth rates and procurement links differed. Primary-material customers focus on composition, processing suitability, batch consistency and guaranteed values; processed-product customers focus on dimensions, uses, packaging and user experience. Market entry should be positioned by supply-chain link rather than describing customers uniformly as the “plastics market.”
The textile chain also shows differences: knitted apparel HS61 grew by 36.97%, non-knitted apparel HS62 by 33.29%, and knitted fabrics HS60 by 21.05%; man-made filament HS54 grew by 0.64%, while man-made staple fibers HS55 fell by 0.91%. Trade changes in finished goods, intermediate materials and raw materials respectively reflect their own product structures. [1]
Finished-goods business organizes content around customer groups, price bands, experience and fulfillment; materials business organizes content around processes, specifications and batches. Separating each link enables more accurate supplier comparison and clarifies what materials sales channels need.
Operations in the consumer chain also need to connect replenishment frequency, in-transit inventory and sales seasons. Product displays explain quality and use, commercial quotations explain total payment and delivery scope, and after-sales records are used to adjust the next batch of procurement. Revenue and repeat-purchase performance are continuously evaluated through these operating records.
Digital market: channel competition under high penetration
The IBGE2025 survey showed that the internet usage rate among the population aged 10 and above was 90.5%, or about 168.7 million people; 95.0% of permanent private households had internet access. Among internet users, 52.7% had purchased or ordered goods/services in the previous three months. [24] [25]
NIQ Ebit’s Webshoppers51 report measured e-commerce GMV in 2024 at R$351.4 billion, up 19.1%. This item uses the institution’s coverage scope of partner online stores and surveys, serving as an industry observation of digital commerce scale. Population surveys, GMV and corporate revenue each use their own definitions. [26] [27]
In Cetic’s TIC Domicílios2024 survey, among those who had purchased online, the share that bought through buying-and-selling websites in the previous 12 months was 90%; own websites accounted for 35%, messaging applications for 31%, and social networks for 22%. This was a multiple-choice survey, so consumers could use multiple channels at the same time. [28]
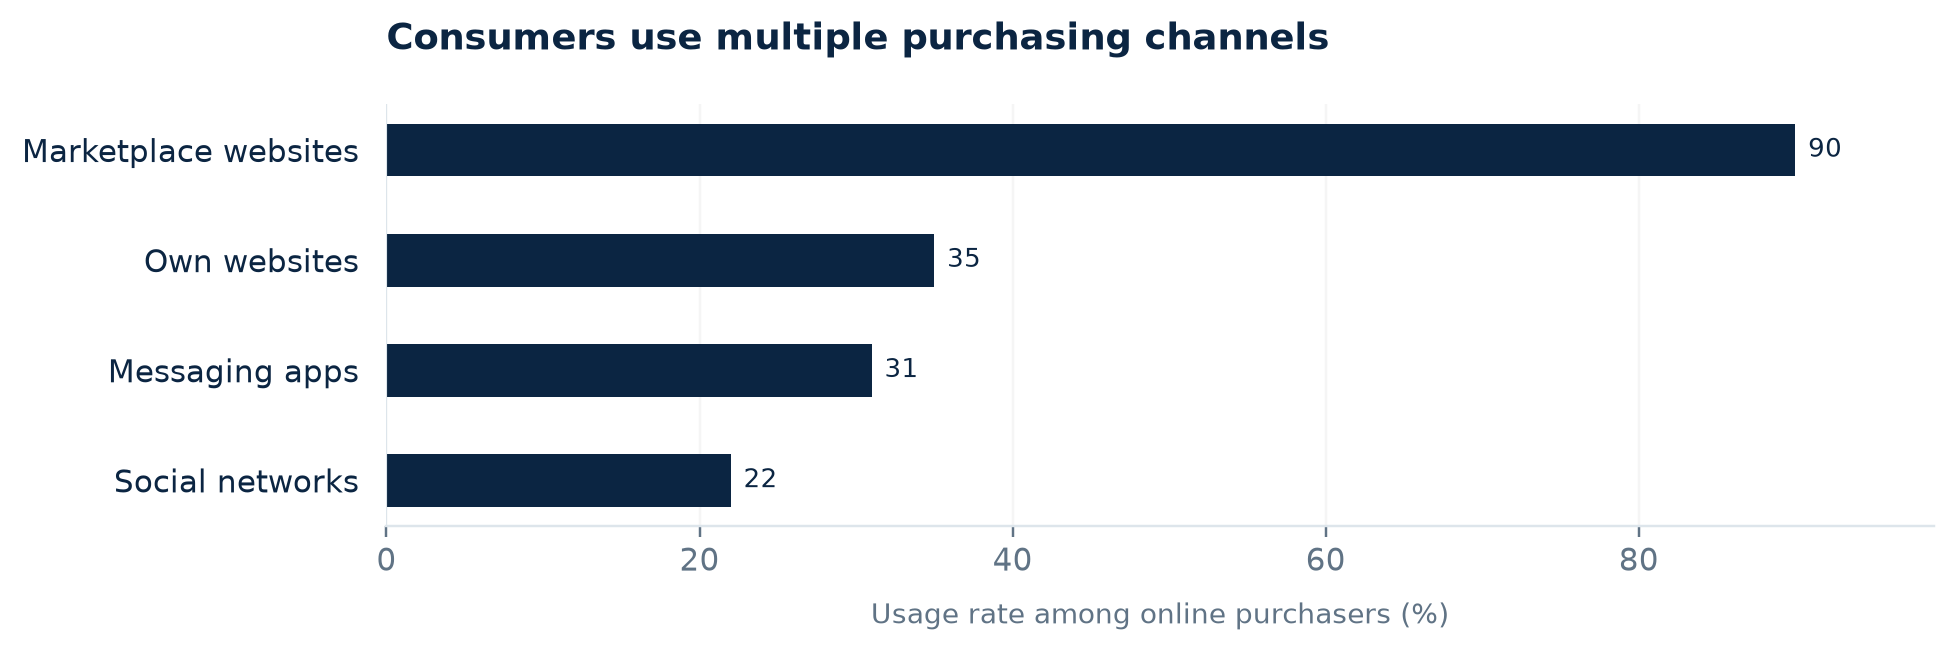
Platforms provide consumers with search, comparison and transaction entry points; messaging applications help clarify specifications, payment and delivery; owned content presents products and services in a concentrated way. To operate in the digital market, companies need to connect customer discovery, consultation, payment and after-sales into a single transaction process.
For retail companies, product content should reduce friction in understanding selection and delivery; for B2B customers, content needs to be converted into technical inquiries or procurement briefs. Channel roles can be recorded separately by first contact and final transaction to identify which content brings in customers and which touchpoints advance orders.
Payment and conversion: Pix, credit and order quality
Among online purchasers in the Cetic2024 survey, 84% used Pix for payment, 67% used credit cards, and 24% used bank slips, all as multiple-choice methods. Central bank administrative records show that in 2025, Pix processed nearly 80 billion transactions, with value exceeding R$35 trillion; person-to-business P2B accounted for 43% of transaction count. Total Pix transactions cover commercial payments, personal transfers and other scenarios. [29] [30] [31]
Pix has become a common payment interface, while credit cards still meet another type of payment need. Merchants need to clearly display the total payment amount, order status and service scope for instant payment, installments and other methods, and connect payment results with delivery receipt records.
In a budget-sensitive environment, payment completion timing for the same product can differ under different payment terms. Under consistent prices, inventory and delivery commitments, companies can compare payment success, receipt, cancellation and post-refund revenue across payment methods.
Order quality needs to be evaluated after delivery. Add-to-cart and checkout initiation indicate front-end interest, payment success indicates transaction progress, and receipt plus net revenue after refunds reflect completed transactions. Repeat customers and new customers should be analyzed separately to understand the long-term effects of promotion, experience and service.
For distribution and project businesses, payment arrangements also include credit, prepayments, acceptance and final payments. In quotation communication, companies should explain the relationship between payment and delivery, manage funds according to customer credit and actual procurement milestones, and keep supply planning aligned with cash collection.
Regional entry: port, warehousing-distribution and sales coverage should be designed together
ANTAQ2025 statistics show that Brazil’s waterway/port system handled about 1.4 billion tonnes of cargo, up 6.1% year-on-year; containers were about 15.3 million TEU, up 10.2%. Tonnes describe weight, while TEU describe standard container slots; they are used to observe different cargo flows. [32]
In August 2026, Santos handled 538200 TEU, up 3.9%; from month 1 to month 8, cargo reached 125.9 million tonnes, up 3.1%. The ports of Paranaguá and Antonina together handled 46.86 million tonnes from month 1 to month 8; Itajaí handled 238873 TEU in January–June 2026, up 75%. Each data point retains the single-port or port-group scope and the corresponding statistical period. [33] [34]
Market entry requires defining the port of landing, terminal, destination state, and warehousing and distribution coverage at the same time. Santos is in São Paulo state (SP), Paranaguá and Antonina are in Paraná state (PR), and Itajaí is in Santa Catarina state (SC); ports and states describe logistics nodes and regional levels respectively.
Fulfilment coverage determines the customer acquisition scope
Companies should first define the delivery areas and lead times they can commit to, then arrange customer acquisition campaigns. Port throughput is used to understand cargo flows; single-shipment delivery is managed by booking, arrival at port, release, warehouse receipt, and available-for-sale date. P50 is the median batch duration, and P95 is the percentile value not exceeded by 95% of batch durations; both are calculated from the company’s actual batches.
The same landing port serves multiple sales regions, with differences in last-mile delivery, warehousing, and customer credit terms. Merchants can observe delivery achievement rates and after-sales costs by destination state, customer type, and order batch size, then allocate regional channel resources.
ABOL cites the ILOS2025 study estimate that logistics costs amount to 15.5% of GDP, including 8.5 percentage points for transport, 5.3 for inventory, 1.0 for warehousing, and 0.6 for management. This is a national logistics cost study. A company’s per-shipment cost should separately list international transport, port and miscellaneous charges, inland transport, warehousing, and financing items. [35]
Customer procurement cost: price competition requires a complete delivery scope
FOB quotations from Chinese suppliers, landed warehouse cost in Brazil, and the price received by customers describe different transaction stages. When comparing similar supply, companies should standardize product specifications, trade terms, taxes and fees, domestic logistics, and service scope.
The eight-digit NCM code and complete product attributes determine the tariff schedule and administrative treatment for ordinary imports, while the importer’s tax regime, destination state, and declaration date determine the specific implementing conditions. II, IPI, PIS/Cofins-Importação, and ICMS are calculated according to their respective tax bases; ICMS is a tax-inclusive structure. [36] [37] [38] [39]
Price space and cost advantages should be compared under the same tax and delivery conditions. Cash payments at import, subsequent creditable tax amounts, and the timing of credits should be listed separately to manage both quotations and capital tied up. Storage, channel commissions, advertising, payment, and after-sales expenses are listed separately as commercial costs.
Companies may define order contribution as: net revenue excluding sales tax after refunds, minus the landed warehouse cost of goods after deducting creditable taxes, and then minus attributable channel commissions, payment, advertising, last-mile delivery, and after-sales expenses. Each cost item should remain mutually exclusive to avoid double-counting logistics or taxes. Observing order growth together with this contribution indicator allows promotions and channels to be evaluated more clearly.
On a simple-interest basis, the financing cost for the stage during which fixed principal is tied up = tied-up principal × effective annual financing cost × days ÷ 365. When the principal changes with payments and collections, calculate each stage separately and add the results. Import taxes already paid still tie up cash before the credit is obtained; the economic cost of the quotation and the cash required for procurement should be managed separately.
Special policies change the entry conditions for some products and companies. Ex-tarifário for capital goods and information and communications goods is implemented according to the applicable NCM, statutory technical description, and qualification; CKD/SKD quotas for automobiles are implemented according to company qualification and licensing. Cost comparisons across different routes must use the same product and transaction conditions. [40] [15] [16]
Anti-dumping measures are also implemented according to product scope. For example, the 78.3% under GECEX817/2025 applies to speakers of Chinese origin weighing more than 18 grams and for use in road motor vehicles, with dashboard buzzers excluded; the US$2.42/kg measure on optical fibre cables excludes submarine cables and OPGW. Product descriptions, taxation units, and exporter/producer information should be checked at the same time. [41] [42]
The CBS0.9% and IBS0.1% in 2026 are statutory test parameters, handled according to the applicable exemptions, offsets, and ancillary obligations; from 2027, CBS and the transition from the old taxes to IBS during 2029–2033 are managed according to the published system timetable. Cross-year contracts and quotations should be arranged according to the rules effective at the corresponding stage. [43] [44]
Market entry conditions: clear local responsibilities support sustained sales
In the Brazilian market, the importer of record, product licence holder, certification applicant, distributor, and after-sales organization each bear business responsibilities. Companies should define authorization, certificate maintenance, changes, quality handling, and batch traceability arrangements in cooperation agreements.
Products regulated by Inmetro enter according to the corresponding conformity assessment requirements, while telecom products enter through ANATEL’s certification and approval route. Changes to model, factory, key components, and software are included in maintenance. International test materials serve as technical evidence; sales eligibility and marking in Brazil are implemented according to the applicable local system. [45] [46] [47]
Medical devices are handled according to the RDC751 risk classification, with Class I/II notification and Class III/IV registration, while implementing the licence-holding entity, applicable AFE qualification, and Portuguese labels/instructions. Pesticides, fertilizers, and foods of animal origin are organized for access according to registration, competent authority, and single-batch documents respectively. [48] [49] [50] [51] [52]
The Duimp product catalogue links NCM, product attributes, manufacturer, and foreign operator to licensing and declaration materials; the migration from DI to Duimp is phased according to business conditions. Document preparation should be linked with supplier materials, procurement contracts, and booking. [53] [54]
Cross-border small parcels and ordinary commercial imports use different business routes. PRC benefits are implemented according to certified platform, individual, DIR, and value conditions, while corporate commercial imports are implemented under the corresponding entity and declaration system. When designing channels, companies need to keep customers, inventory, importer of record, and tax route consistent. [55] [56]
Commercial entry: building sustainable procurement relationships from customer use cases
Determine the entry approach from existing customers and channel resources
Retail and private-label business is positioned around customer groups, user experience, price bands, and after-sales; wholesale and distribution are positioned around downstream procurement frequency, specifications, credit, and inventory; industrial and project procurement are positioned around technical fit, funding, installation, and acceptance.
Companies first clarify the procurement problem being solved, then determine the supplier comparison criteria. For example, periodic replenishment requires stable batches and delivery schedules; project procurement requires parameters, technical materials, and acceptance; channel brands require packaging, quality, and user experience. Different businesses organize sales content and partners separately.
Connect customers and suppliers with the same procurement benchmark
A procurement brief states the target use, specifications, quantity, packaging, trade terms, payment, and acceptance. Sample or technical evaluation determines functional, material, dimensional, and batch requirements around actual use conditions. Quotations distinguish goods, logistics, taxes and fees, and local services; orders define changes, payment, and quality responsibilities.
This approach lets customers compare options and also lets suppliers clarify delivery targets. The technical, quality, and delivery materials formed in the first procurement can be used for the next batch, reducing repeated communication costs.
Connect customer acquisition content with the customer decision stage
For consumer customers, content explains product use, experience, and delivery; for distributors, it explains supply frequency, packaging, and after-sales; for technical procurement, it explains parameters, fit, and project services. Quotation acceptance, payment, receipt, and repeat purchase measure progress at each stage respectively.
ExpandOcean focuses on Chinese supplier research, comparable quotations, samples, and product development support, and coordinates quality and logistics cooperation resources to conduct commercial project communication. Clients can bring target markets, procurement uses, specifications, and scale to discuss the scope of supply and channel collaboration. [57]
Project communication entry point: expandocean.co. Use a clear procurement brief to carry out market and supply communication, and advance cooperation around product, quotation, and delivery arrangements.
Next quarter: connecting market observation to operating rhythm
Trade and competition. Track the like-for-like share of Chinese origin and Brazil’s global imports monthly, separately listing value and physical volume, and observe chapter-level increments and breadth of growth in automobiles, electronics, machinery, and materials. Origin structure and customer procurement comparisons work together.
Demand and sales. For retail, look at payment, receipt, and returns; for distribution, look at replenishment and credit; for industrial projects, look at technical specifications, contracts, funding, and acceptance. Managing data by customer group and price band makes it clearer to identify demand and cost changes.
Region and fulfilment. Connect destination state, delivery coverage, and available-for-sale inventory to marketing commitments, and track delivery, quality, and cash conversion by actual batch. Growth plans should arrange procurement, channel inventory, and collections at the same time.
Cross-year operating conditions. 31 October 2026 is the application node for the specified automobile ratio quota; on 11 1, balance redistribution is handled according to the rules; the 2027 Duimp tax reform electronic document node is included in cross-year contract and data planning. Special businesses are arranged according to effective tariffs, qualifications, and licences. [58] [16]
Data basis and cited sources
Trade data use the Brazil imports, Chinese origin, USD FOB basis. The full year 2025 is US$70.916 billion, January–September 2025 is US$53.353 billion, and January–September 2026 is US$58.623 billion; year-on-year comparisons always use the same period. Comex Stat data are available through September 2026, the official update date is 6 October 2026, and the report data cut-off is 16 October 2026. [1] [2]
The three periods cover 1069 HS4 headings with trade, for a total of 3207 item-by-item value verification points, all consistent with the official query. HS2 refers to chapters and HS4 refers to headings; tax and administrative treatment use the complete eight-digit NCM and product attributes. In the complete query, absent headings are counted as zero according to aggregation rules, and year-on-year values without a prior-period base remain blank.
Net incremental contribution uses the corresponding aggregate net change as the denominator, breadth of growth is counted by headings at the same level, and exclusion analysis removes the corresponding headings in both periods and recalculates year-on-year growth. Industry portfolios use mutually exclusive coding. Values, growth rates, and percentage-point changes are all calculated using unrounded values and then rounded to the displayed precision; displayed values may have rounding differences when added or subtracted. Value measures trade value, while procurement physical volume, customer repeat purchase, and end sales use the corresponding data respectively. Global values, shares, and economic-use categories use the same official API version.
Macroeconomic data retain seasonally adjusted quarter-on-quarter, year-on-year, or moving-quarter definitions; business surveys retain retrospective and planned measures; financing retains approvals and disbursements; digital channels retain survey population and multiple-response definitions; ports retain single-port, port-cluster, and statistical-period definitions. Annual actuals, industry surveys, and association point-in-time statistics are cited according to their original definitions.
Sources
- Comex Stat: Brazil import query and HS4 detail
- Comex Stat: official API documentation
- IBGE: Q2 2026 GDP growth of 0.5% (2026-09-01)
- IBGE: GDP growth of 2.3% in 2025 (2026-03-03)
- IBGE: IPCA was 0.82% in September 2026 (2026-10-09)
- IBGE: PNAD Continuous survey for the moving quarter through August 2026 (2026-09-29)
- Central Bank of Brazil: Copom cuts Selic to 13.75% (2026-09-16)
- Central Bank of Brazil: Selic rate definition and transmission mechanism
- MDIC/SECEX: Brazil monthly trade report for September 2026 (consolidated data)
- MDIC/SECEX: Brazil foreign trade consolidated historical series (updated September 2026)
- ANFAVEA: October 2026 press release (through month 9)
- ANFAVEA Data Center: notes on statistical methodology
- ABVE Data: light electrified vehicles through September 2026
- MDIC: MOVER Program (updated 2026-07-06)
- GECEX927/2026 official gazette: vehicle quotas
- SECEX513/2026 official gazette: vehicle quota allocation
- IBGE: annual results for industrial production in 2025
- IBGE: August 2026 PIM-PF release
- CNI: industrial investment survey 2025–2026
- BNDES: operating performance in 2025
- EPE, Summary of the BEN 2025 Report (2024 base year)
- ABSOLAR: Brazilian photovoltaic statistics snapshot (updated 2026-07-20)
- ANEEL: micro and mini distributed generation rules (updated 2026-06-09)
- IBGE PNAD Continuous: individual internet use and online purchasing in 2025, 2026-07-02
- IBGE PNAD Continuous: household internet access in 2025, 2026-07-02
- NielsenIQ Ebit, Webshoppers 51 Free (2025-04, PDF does not list a specific day)
- NielsenIQ Ebit Webshoppers product and report scope notes (page does not indicate publication date)
- Cetic.br/NIC.br: buyers by purchase channel (2024 data; page does not list publication date)
- Cetic.br/NIC.br: payment methods for online purchases (2024 data; page does not list publication date)
- Central Bank of Brazil, Pix Management Report 2023–2025, 2026-08-10
- Brazilian Ministry of Finance: central bank 2025 Pix management report release and statistics, 2026-08-19
- Agência Porto reprint of ANTAQ, Desempenho Aquaviário 2025 full-year statistics (2026-02-11)
- Brazilian Ministry of Ports and Airports: port cargo volume in August 2026 (published 2026-09-28, revised 2026-09-30)
- Brazilian Ministry of Ports and Airports: cargo flows at nine ports in the first half of 2026 (2026-08-03)
- ABOL: summary of the ILOS 2025 logistics cost study (2026-02-26)
- MDIC: Brazil’s current tariffs and annexes to GECEX Resolution No. 272
- Complementary Law 87/1996
- Brazilian Federal Revenue import tax and fee simulator terminology
- PGFN: PIS/COFINS on Imports
- GECEX Resolution No. 512 (consolidated text)
- GECEX Resolution No. 837, of December 19, 2025
- GECEX Resolution No. 817, of November 27, 2025
- Constitutional Amendment 132/2023: ADCT Articles 125–130
- Consolidated text of Supplementary Law 214/2025 (including amendments under LC227/2026)
- Inmetro Ordinance No. 200, of April 29, 2021 — General Requirements for Product Certification
- Anatel Resolution No. 715, of October 23, 2019 — Regulation on Conformity Assessment and Approval of Telecommunications Products
- Anatel Resolution No. 780, of August 1, 2025 — amendments to the Approval Regulation
- ANVISA RDC No. 751/2022 (current consolidated text, as amended)
- ANVISA RDC No. 16/2014 (current consolidated text on AFE)
- Brazilian Law No. 14,785/2023
- Brazilian Decree No. 4,954/2004 (registration and import rules for fertilizers and related products)
- MAPA: Imports of Animal-Origin Products (implementation of Article 486 of Decree No. 9,013/2017)
- Receita Federal: Duimp Product Catalog
- Siscomex: DI Phase-Out Schedule
- Receita Federal: Taxation (RTS, PRC and ICMS)
- Receita Federal: Customs Declaration (DIR, DSI and DI)
- ExpandOcean: Brazil Market and Sourcing Services Overview
- RFB/CGIBS Joint Document No. 4: Electronic Fiscal Document Schedule